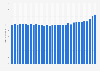
Veuillez noter que la page demandée n’est pas disponible dans la langue par défaut sélectionnée. Vous utilisez notre plateforme dans une autre langue maintenant.
Globally, the average online order value (AOV) of luxury handbags was approximately 564.5 U.S. dollars in the second quarter of 2023, up from 556.8 dollars in the previous quarter.
Value of average online order (AOV) of luxury handbags from 2nd quarter 2021 to 2nd quarter 2023 (in U.S. dollars)
Basic Account
Get to know the platform
You only have access to basic statistics.
This statistic is not included in your account.
Starter Account
The ideal entry-level account for individual users
- Instant access to 1m statistics
- Download in XLS, PDF & PNG format
- Detailed references
$199 USD / Month *
Professional Account
Full access
Business Solutions including all features.
* Prices do not include sales tax.
Other statistics that may interest you Statistics on
About the industry
10
- Premium Statistic Luxury shopping offline reasons in China 2018
- Premium Statistic Luxury shopping online satisfaction rating in China 2018, by platform
- Premium Statistic Consumers who bought an item on social media in the UK 2022, by generation
- Premium Statistic Most popular online shops in Australia 2023
- Premium Statistic Use of e-commerce by individuals in Norway 2013-2022
- Premium Statistic Most popular online shops in Spain 2023
- Premium Statistic Most popular online shops in Italy 2023
- Premium Statistic Most popular online shops in France 2023
- Premium Statistic Most popular online shops in the UK 2023
- Premium Statistic Most popular online shops in Austria 2023
About the region
10
- Basic Statistic Capri Holdings' global revenue from 2017 to 2023
- Basic Statistic Capri Holdings' global revenue in 2023, by region
- Basic Statistic Michael Kors' global revenue in 2023, by region
- Basic Statistic Global revenue of Versace in 2023, by region
- Basic Statistic Global net sales of Versace from 2019 to 2023
- Basic Statistic Quarterly global net revenue of Amazon 2017-2024, by product group
- Premium Statistic Number of page views per web session 2022, by vertical & device
- Premium Statistic Rakuten Group's annual revenue FY 2014-2023
- Premium Statistic Gen Z search engine vs. social media use for brand or product research 2015-2022
- Basic Statistic Annual net sales of Amazon 2004-2023
Selected statistics
4
- Premium Statistic India: leading e-commerce categories 2013, by sales
- Basic Statistic Consumer electronics: Online purchasing in Great Britain 2020, by demographic
- Premium Statistic Channels consumers use for their main grocery shop in the United Kingdom (UK) 2013
- Premium Statistic Where consumers shop for clothing and footwear in the United Kingdom (UK) 2013
Other regions
10
- Premium Statistic Online shopping frequency in France 2022
- Premium Statistic Preferred delivery methods among online shoppers in Norway 2021
- Premium Statistic Consumer shopping (online or in-store) at luxury UK fashion retailers January 2021
- Premium Statistic Return rate of distance selling orders in Western and Southern Europe in 2013
- Premium Statistic Annual B2C sales value growth in Russia 2018-2022
- Premium Statistic Food items frequently purchased online during COVID 19 Philippines 2020, by gender
- Premium Statistic Number of digital buyers in Peru 2019-2022
- Premium Statistic E-commerce market size in Argentina 2022-2026, by device
- Basic Statistic Online shopping frequency in Finland 2023, by social group
- Basic Statistic Digital buyer penetration in Panama 2022, by gender
Related statistics
10
- Premium Statistic E-commerce sales revenue in France 2005-2023
- Premium Statistic Online shopping penetration in France 2022, by age
- Premium Statistic E-commerce user penetration in France 2003-2022
- Premium Statistic France: Top 10 online stores
- Premium Statistic Revenue of the online food delivery market U.S. 2017-2028
- Premium Statistic Revenue of the online beauty and personal care industry in France 2017-2027
- Premium Statistic Number of users of online beauty and personal care in France 2017-2027
- Premium Statistic Revenue of the e-commerce industry in Europe 2020-2029
- Basic Statistic Fashion: top 5 online stores in France in 2022, by net sales
- Premium Statistic Revenue of the online food delivery market in selected countries 2024
Further related statistics
10
- Fragrance market value in Great Britain 2022, by product type
- Skincare market value in Great Britain 2022, by product type
- Toiletry market value in Great Britain 2022, by product type
- Skincare market value in Great Britain 2009-2022
- Ethical personal products: spending in the United Kingdom (UK) 2011-2021
- Leading online retailers in Southeast Asia 2020, by monthly visits
- Travel arrangements: Online purchasing in Great Britain 2019, by demographic
- Use of smartphones by shoppers in retail stores in Italy in 2015
- Unique visitors to most popular online retailers in India 2014
- Furniture shopping: Consumers' delivery preferences in the United Kingdom (UK) 2013
Further Content: You might find this interesting as well
Statistics
- Fragrance market value in Great Britain 2022, by product type
- Skincare market value in Great Britain 2022, by product type
- Toiletry market value in Great Britain 2022, by product type
- Skincare market value in Great Britain 2009-2022
- Ethical personal products: spending in the United Kingdom (UK) 2011-2021
- Leading online retailers in Southeast Asia 2020, by monthly visits
- Travel arrangements: Online purchasing in Great Britain 2019, by demographic
- Use of smartphones by shoppers in retail stores in Italy in 2015
- Unique visitors to most popular online retailers in India 2014
- Furniture shopping: Consumers' delivery preferences in the United Kingdom (UK) 2013
Salesforce Research. (September 19, 2023). Value of average online order (AOV) of luxury handbags from 2nd quarter 2021 to 2nd quarter 2023 (in U.S. dollars) [Graph]. In Statista. Retrieved May 12, 2024, from https://www.statista.com/statistics/1334238/luxury-handbags-average-online-order-value/
Salesforce Research. "Value of average online order (AOV) of luxury handbags from 2nd quarter 2021 to 2nd quarter 2023 (in U.S. dollars)." Chart. September 19, 2023. Statista. Accessed May 12, 2024. https://www.statista.com/statistics/1334238/luxury-handbags-average-online-order-value/
Salesforce Research. (2023). Value of average online order (AOV) of luxury handbags from 2nd quarter 2021 to 2nd quarter 2023 (in U.S. dollars). Statista. Statista Inc.. Accessed: May 12, 2024. https://www.statista.com/statistics/1334238/luxury-handbags-average-online-order-value/
Salesforce Research. "Value of Average Online Order (Aov) of Luxury Handbags from 2nd Quarter 2021 to 2nd Quarter 2023 (in U.S. Dollars)." Statista, Statista Inc., 19 Sep 2023, https://www.statista.com/statistics/1334238/luxury-handbags-average-online-order-value/
Salesforce Research, Value of average online order (AOV) of luxury handbags from 2nd quarter 2021 to 2nd quarter 2023 (in U.S. dollars) Statista, https://www.statista.com/statistics/1334238/luxury-handbags-average-online-order-value/ (last visited May 12, 2024)
Value of average online order (AOV) of luxury handbags from 2nd quarter 2021 to 2nd quarter 2023 (in U.S. dollars) [Graph], Salesforce Research, September 19, 2023. [Online]. Available: https://www.statista.com/statistics/1334238/luxury-handbags-average-online-order-value/