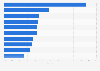
Veuillez noter que la page demandée n’est pas disponible dans la langue par défaut sélectionnée. Vous utilisez notre plateforme dans une autre langue maintenant.
ThyssenKrupp's sales in FY 2020/21, by main segment (in million euros)
Basic Account
Get to know the platform
You only have access to basic statistics.
This statistic is not included in your account.
Starter Account
The ideal entry-level account for individual users
- Instant access to 1m statistics
- Download in XLS, PDF & PNG format
- Detailed references
$199 USD / Month *
Professional Account
Full access
Business Solutions including all features.
* Prices do not include sales tax.
Other statistics that may interest you Statistics on
About the industry
10
- Premium Statistic ThyssenKrupp - net income/loss 2007-2023
- Premium Statistic ThyssenKrupp - EBIT 2007-2021
- Premium Statistic Global steel usage by sector 2022
- Premium Statistic Import value of iron and steel in Poland 2008-2022
- Premium Statistic Monthly iron and steel manufacturing GDP in Canada 2023
- Premium Statistic Reliance Steel & Aluminum: sales by product as a share of sales 2017
- Premium Statistic Steel industry: global capacity utilization rate by region 2016
- Premium Statistic Global steel industry - Nucor Corporation's revenue 2006-2022
- Premium Statistic ABB Group's revenue by segment FY 2023
- Premium Statistic Crude steel production in Latin America 2014-2023
About the region
10
- Premium Statistic ZF Friedrichshafen AG - sales by segment 2023
- Premium Statistic Magna: sales by segment 2022
- Premium Statistic ZF Friedrichshafen AG sales revenue 2009-2023
- Premium Statistic Global revenue of Aptiv by segment 2020-2022
- Premium Statistic ZF Friedrichshafen AG - sales by region 2023
- Premium Statistic AutoZone's net sales 2010-2023
- Premium Statistic AutoZone's operating profit 2010-2023
- Basic Statistic Denso - global revenue 2008-2023
- Premium Statistic Global stainless steel usage by sector 2022
- Basic Statistic Sales revenue of ArcelorMittal 2006-2023
Selected statistics
3
Other regions
10
- Premium Statistic Capacity utilization for the production of crude steel India 2016-2022
- Premium Statistic U.S. auto dealerships - sales breakdown by department 2018-2021
- Basic Statistic Spain: turnover of the steel casting industry 2012-2021
- Premium Statistic Mexico: annual tire sales volume 2014-2019
- Premium Statistic Semi-finished and finished steel goods export in Poland 2009-2019
- Premium Statistic Production volume of stainless steel in Europe 2013-2018
- Premium Statistic Steel mill import value in Russia 2021, by product
- Premium Statistic Production of crude steel in the EU, by quality 2011-2022
- Premium Statistic EU-27: main exporting countries of semi-finished steel products from 2010-2022
- Premium Statistic Liquid steel production for castings in the United Kingdom (UK) from 2009 to 2022
Related statistics
10
- Premium Statistic Crude steel production share in Latin America by country 2023
- Premium Statistic Production of pig iron in the United Kingdom 2009-2022
- Premium Statistic UK: crude steel produced in electric furnaces 2009-2021
- Premium Statistic Monthly production of crude steel in the United Kingdom (UK) 2022
- Premium Statistic Semi-finished and finished steel goods export in the United Kingdom (UK) 2004-2022
- Premium Statistic Semi-finished and finished steel good imports in the United Kingdom (UK) 2004 to 2022
- Premium Statistic Latin America crude steel production by country 2019-2022
- Premium Statistic Celsa UK Holdings annual turnover 2011-2022
- Premium Statistic Global automotive & aerospace steel market size 2020-2027
- Premium Statistic Nucor's net sales by product category 2021
Further related statistics
10
- Sales of Johnson & Johnson worldwide 2011-2023, by segment
- Sales of Johnson & Johnson 2006-2023 by region
- BASF's revenue in the Oil & Gas segment 2007-2017
- Forecast: global data center IP traffic 2013-2021, by segment
- Revenue of Saudi Basic Industries by segment 2013-2016
- U.S. export and import waterborne freight 2010
- Global net sales of Monster Beverage 2008-2022
- BayWa's revenue by segment 2010-2022
- The adidas Group's global net sales from 2002 to 2023, by product category
- The adidas Group's global footwear production from 2008-2023
Further Content: You might find this interesting as well
Statistics
- Sales of Johnson & Johnson worldwide 2011-2023, by segment
- Sales of Johnson & Johnson 2006-2023 by region
- BASF's revenue in the Oil & Gas segment 2007-2017
- Forecast: global data center IP traffic 2013-2021, by segment
- Revenue of Saudi Basic Industries by segment 2013-2016
- U.S. export and import waterborne freight 2010
- Global net sales of Monster Beverage 2008-2022
- BayWa's revenue by segment 2010-2022
- The adidas Group's global net sales from 2002 to 2023, by product category
- The adidas Group's global footwear production from 2008-2023
Thyssenkrupp. (November 18, 2021). ThyssenKrupp's sales in FY 2020/21, by main segment (in million euros) [Graph]. In Statista. Retrieved May 13, 2024, from https://www.statista.com/statistics/271782/revenue-of-the-conglomerate-thyssenkrupp-by-segment/
Thyssenkrupp. "ThyssenKrupp's sales in FY 2020/21, by main segment (in million euros)." Chart. November 18, 2021. Statista. Accessed May 13, 2024. https://www.statista.com/statistics/271782/revenue-of-the-conglomerate-thyssenkrupp-by-segment/
Thyssenkrupp. (2021). ThyssenKrupp's sales in FY 2020/21, by main segment (in million euros). Statista. Statista Inc.. Accessed: May 13, 2024. https://www.statista.com/statistics/271782/revenue-of-the-conglomerate-thyssenkrupp-by-segment/
Thyssenkrupp. "Thyssenkrupp's Sales in Fy 2020/21, by Main Segment (in Million Euros)." Statista, Statista Inc., 18 Nov 2021, https://www.statista.com/statistics/271782/revenue-of-the-conglomerate-thyssenkrupp-by-segment/
Thyssenkrupp, ThyssenKrupp's sales in FY 2020/21, by main segment (in million euros) Statista, https://www.statista.com/statistics/271782/revenue-of-the-conglomerate-thyssenkrupp-by-segment/ (last visited May 13, 2024)
ThyssenKrupp's sales in FY 2020/21, by main segment (in million euros) [Graph], Thyssenkrupp, November 18, 2021. [Online]. Available: https://www.statista.com/statistics/271782/revenue-of-the-conglomerate-thyssenkrupp-by-segment/