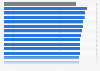
Veuillez noter que la page demandée n’est pas disponible dans la langue par défaut sélectionnée. Vous utilisez notre plateforme dans une autre langue maintenant.
This statistic shows the percentage of U.S. patients that were prescribed medication in the past 12 months and the resources they would use if they had questions regarding their medication as of 2017, by generation. According to the survey, 17 percent of Millennials stated that they would ask family or friends about their prescription medications.
Percentage of U.S. patients that used select resources for questions about their prescription medications as of 2017, by generation
Basic Account
Get to know the platform
You only have access to basic statistics.
This statistic is not included in your account.
Starter Account
The ideal entry-level account for individual users
- Instant access to 1m statistics
- Download in XLS, PDF & PNG format
- Detailed references
$199 USD / Month *
Professional Account
Full access
Business Solutions including all features.
* Prices do not include sales tax.
Other statistics that may interest you Statistics on
About the industry
10
- Premium Statistic U.S. patients that were prescribed select treatments as of 2017, by generation
- Basic Statistic Communication technology among U.S. patients and insurances 2017, by generation
- Premium Statistic U.S. patients that used select methods to track their health data 2017, by generation
- Premium Statistic Priority medical procedures in Canada within benchmark time 2010-2023
- Basic Statistic Share of medical procedures in Canada within benchmark wait time 2023, by province
- Basic Statistic Cancer surgery wait times in Canada within 90th percentile 2015-2023, by type
- Basic Statistic Federally funded health center staff distribution in the U.S. 2020
- Premium Statistic EMR use by primary care physicians in Canada in 2021, by province/region
- Basic Statistic Health center behavioral health staff distribution by type U.S. 2020
- Premium Statistic Opinion on healthcare system in Russia 2020
About the region
10
- Basic Statistic U.S. patients' concerns regarding AI use in healthcare in 2017, by generation
- Premium Statistic U.S. patients' enthusiasm about AI use in healthcare in 2017, by generation
- Basic Statistic U.S. patients that used select technologies to make appointments 2017, by generation
- Basic Statistic U.S. patients that used select ways to view health data 2017, by generation
- Premium Statistic Share of health organizations able to remotely access select data U.S. 2018-2019
- Basic Statistic Share of health organizations that linked monitoring equipment to EHR, U.S. 2019
- Basic Statistic Portrait of a U.S. physician 2018
- Basic Statistic Portrait of a U.S. physician 2018, by employment type
- Premium Statistic Costs for laparoscopic vs. robot-assisted radical nephrectomy U.S. 2003-2015
- Premium Statistic Rate of adverse events in robot-assisted procedures U.S. 2004-2013
Other regions
10
- Premium Statistic England: rating of the healthcare system from physicians and consumers in 2018
- Premium Statistic Medical Tourism Index ranking of Colombia 2020, by dimension
- Basic Statistic EMR use by primary care physicians in Canada 2004-2021
- Premium Statistic Leading orphan designations in the EU by indication 2015
- Premium Statistic Medical Tourism Index ranking of Brazil 2020, by dimension
- Premium Statistic Confidence of the people in various actors for entrusting their health data 2019
- Premium Statistic Public medical service employees in Dubai 2020, by profession
- Basic Statistic Community health center dental staff by type U.S. 2021
- Basic Statistic Opinions on the affordability of good healthcare in Belgium 2023
- Premium Statistic Revenue of the human health activities in Italy 2021, by sector
Related statistics
10
- Premium Statistic Top home care chains by number of agencies in the U.S. 2015
- Premium Statistic Largest nursing home chains in the U.S. by staffed beds 2015
- Premium Statistic Average occupancy rate of licensed nursing home beds in the U.S. by owner 2014-2015
- Premium Statistic Top 5 assisted living chains by number of facilities in the U.S. 2014-2015
- Premium Statistic Long-term care facilities in the U.S. by type 2006-2015
- Premium Statistic Number of beds in licensed nursing homes in the U.S. 1994-2015
- Premium Statistic Top home care chains by number of weekly visits in the U.S. 2014
- Premium Statistic Colombia: most common cosmetic surgeries 2022
- Premium Statistic Number of chiropractic licenses in the U.S. 1996-2020
- Premium Statistic U.S. adults who had traveled abroad for medical treatment 2019, by generation
Further related statistics
10
- Cost savings through urgent care vs emergency department 2012
- Mental health and substance abuse services industry revenues in the U.S. 2008-2018
- Net earnings of UnitedHealth Group 2007-2023
- Percentage of U.S. population with employment-based health insurance 1987-2022
- Location of death among hospice patients in the U.S. 2018
- Size of U.S. hospices by number of admissions 2012-2014
- Global revenue share of EssilorLuxottica in 2022, by geographical area
- Medicare - number of skilled nursing facilities in the U.S. 1967-2021
- Total assets of UnitedHealth Group 2007-2023
- Overweight prevalence in England 2000-2021, by gender
Further Content: You might find this interesting as well
Statistics
- Cost savings through urgent care vs emergency department 2012
- Mental health and substance abuse services industry revenues in the U.S. 2008-2018
- Net earnings of UnitedHealth Group 2007-2023
- Percentage of U.S. population with employment-based health insurance 1987-2022
- Location of death among hospice patients in the U.S. 2018
- Size of U.S. hospices by number of admissions 2012-2014
- Global revenue share of EssilorLuxottica in 2022, by geographical area
- Medicare - number of skilled nursing facilities in the U.S. 1967-2021
- Total assets of UnitedHealth Group 2007-2023
- Overweight prevalence in England 2000-2021, by gender
Harris Poll, & Salesforce Research. (June 27, 2017). Percentage of U.S. patients that used select resources for questions about their prescription medications as of 2017, by generation [Graph]. In Statista. Retrieved June 03, 2024, from https://www.statista.com/statistics/813911/resources-for-patients-with-prescription-questions-us/
Harris Poll, und Salesforce Research. "Percentage of U.S. patients that used select resources for questions about their prescription medications as of 2017, by generation." Chart. June 27, 2017. Statista. Accessed June 03, 2024. https://www.statista.com/statistics/813911/resources-for-patients-with-prescription-questions-us/
Harris Poll, Salesforce Research. (2017). Percentage of U.S. patients that used select resources for questions about their prescription medications as of 2017, by generation. Statista. Statista Inc.. Accessed: June 03, 2024. https://www.statista.com/statistics/813911/resources-for-patients-with-prescription-questions-us/
Harris Poll, and Salesforce Research. "Percentage of U.S. Patients That Used Select Resources for Questions about Their Prescription Medications as of 2017, by Generation." Statista, Statista Inc., 27 Jun 2017, https://www.statista.com/statistics/813911/resources-for-patients-with-prescription-questions-us/
Harris Poll & Salesforce Research, Percentage of U.S. patients that used select resources for questions about their prescription medications as of 2017, by generation Statista, https://www.statista.com/statistics/813911/resources-for-patients-with-prescription-questions-us/ (last visited June 03, 2024)
Percentage of U.S. patients that used select resources for questions about their prescription medications as of 2017, by generation [Graph], Harris Poll, & Salesforce Research, June 27, 2017. [Online]. Available: https://www.statista.com/statistics/813911/resources-for-patients-with-prescription-questions-us/