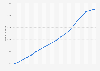
Veuillez noter que la page demandée n’est pas disponible dans la langue par défaut sélectionnée. Vous utilisez notre plateforme dans une autre langue maintenant.
This statistic shows the per capita daily time spent on computers in South Korea from 2011 to 2017. As of July 2017, time spent on computer use per day amounted to around 201 minutes per capita on average.
Time spent on computer per capita on daily basis in South Korea from 2011 to 2017 (in minutes)
Basic Account
Get to know the platform
You only have access to basic statistics.
This statistic is not included in your account.
Starter Account
The ideal entry-level account for individual users
- Instant access to 1m statistics
- Download in XLS, PDF & PNG format
- Detailed references
$199 USD / Month *
Professional Account
Full access
Business Solutions including all features.
* Prices do not include sales tax.
Other statistics that may interest you Statistics on
About the industry
10
- Premium Statistic South Korea's average media usage 2011-2017, by medium
- Premium Statistic Time spent on printed media per person per day in South Korea 2011-2017
- Premium Statistic Daily time spent on media in South Korea 2017, by type
- Premium Statistic Desktop computer penetration rate South Korea 2011-2022
- Premium Statistic Desktop computer penetration South Korea 2022, by household income
- Premium Statistic South Korea's media device ownership 2018, by medium
- Premium Statistic Tablet PC penetration rate South Korea 2012-2022
- Premium Statistic Average number of video game consoles per household in South Korea 2013-2023
- Premium Statistic Regular internet activities of children in Germany 2022, by gender
- Premium Statistic Frequency of computer use among children in the U.S. 2011-2017
About the region
10
- Premium Statistic Monthly household spending on information processing equipment South Korea 2017-2023
- Premium Statistic Annual per capita chocolate consumption in South Korea 2011-2015
- Premium Statistic Bank customer satisfaction index in South Korea 2021
- Basic Statistic Number of users of social media advertising in South Korea 2019-2028
- Premium Statistic Decaffeinated green coffee import value in South Korea 2022, by origin
- Premium Statistic Decaffeinated green coffee import volume in South Korea 2022, by origin
- Premium Statistic Number of savings bank branches South Korea 2011-2022
- Premium Statistic South Korea's number of military forces in comparison to North Korea 2022, by type
- Premium Statistic Countries in diplomatic relations with South and North Korea 2022, by continent
- Premium Statistic TMON sales revenue South Korea 2013-2022
Selected statistics
2
Other regions
10
- Basic Statistic Computer penetration rate among households in the Americas 2005-2019
- Basic Statistic Computer penetration rate among households worldwide 2005-2019
- Basic Statistic Computers/PCs household adoption rate in the U.S. 1984-2016
- Premium Statistic PC shipments in China in 2011, by category
- Basic Statistic Computer penetration rate among households in Africa 2005-2019
- Premium Statistic Mexico: share of households with a computer 2018, by state
- Premium Statistic Computer penetration in households in Norway 2015-2018
- Premium Statistic Computer penetration in households in Sweden 2015-2018
- Premium Statistic Computer penetration in households in Finland 2015-2018
- Premium Statistic Argentina: best selling notebook brands 2018
Related statistics
10
- Premium Statistic E-sports club budget scale South Korea 2015-2022
- Premium Statistic Watching OTT video devices in South Korea 2021
- Premium Statistic Computer usage rate South Korea 2022, by gender
- Premium Statistic Computer usage rate South Korea 2022, by age group
- Premium Statistic Spending on smartphones South Korea 2023
- Premium Statistic Smartphone TV watching locations in South Korea 2022, by age group
- Premium Statistic Professional gamer post retirement plan in South Korea 2020
- Premium Statistic Frequency of food service use among South Koreans 2019, by type
- Premium Statistic Spending on takeaways in South Korea 2014-2019
- Premium Statistic Frequency of food service use alone in South Korea 2019, by age group
Further related statistics
9
- China: computer production 2008-2010
- Global PC sales via direct salesforces 2010, by vendor
- Lotte World Adventure theme park attendance South Korea 2009-2022
- Per capita municipal solid waste recycled in the U.S. 1960-2018
- Daily internet use penetration in Great Britain 2006-2020
- Top 10 most expensive conditions treated in the U.S. - hospitals stays 2017
- Hours of internet use per week in the United Kingdom (UK) 2005-2019, by location
- Frequency of watching national news in the U.S. 2013-2016
- Leading trends in ethnic cuisines on restaurant menus in the U.S. 2015
Further Content: You might find this interesting as well
Statistics
- China: computer production 2008-2010
- Global PC sales via direct salesforces 2010, by vendor
- Lotte World Adventure theme park attendance South Korea 2009-2022
- Per capita municipal solid waste recycled in the U.S. 1960-2018
- Daily internet use penetration in Great Britain 2006-2020
- Top 10 most expensive conditions treated in the U.S. - hospitals stays 2017
- Hours of internet use per week in the United Kingdom (UK) 2005-2019, by location
- Frequency of watching national news in the U.S. 2013-2016
- Leading trends in ethnic cuisines on restaurant menus in the U.S. 2015
KISDISTAT. (December 15, 2017). Time spent on computer per capita on daily basis in South Korea from 2011 to 2017 (in minutes) [Graph]. In Statista. Retrieved May 16, 2024, from https://www.statista.com/statistics/751381/south-korea-daily-time-spent-on-computer-per-capita/
KISDISTAT. "Time spent on computer per capita on daily basis in South Korea from 2011 to 2017 (in minutes)." Chart. December 15, 2017. Statista. Accessed May 16, 2024. https://www.statista.com/statistics/751381/south-korea-daily-time-spent-on-computer-per-capita/
KISDISTAT. (2017). Time spent on computer per capita on daily basis in South Korea from 2011 to 2017 (in minutes). Statista. Statista Inc.. Accessed: May 16, 2024. https://www.statista.com/statistics/751381/south-korea-daily-time-spent-on-computer-per-capita/
KISDISTAT. "Time Spent on Computer per Capita on Daily Basis in South Korea from 2011 to 2017 (in Minutes)." Statista, Statista Inc., 15 Dec 2017, https://www.statista.com/statistics/751381/south-korea-daily-time-spent-on-computer-per-capita/
KISDISTAT, Time spent on computer per capita on daily basis in South Korea from 2011 to 2017 (in minutes) Statista, https://www.statista.com/statistics/751381/south-korea-daily-time-spent-on-computer-per-capita/ (last visited May 16, 2024)
Time spent on computer per capita on daily basis in South Korea from 2011 to 2017 (in minutes) [Graph], KISDISTAT, December 15, 2017. [Online]. Available: https://www.statista.com/statistics/751381/south-korea-daily-time-spent-on-computer-per-capita/