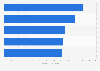
Veuillez noter que la page demandée n’est pas disponible dans la langue par défaut sélectionnée. Vous utilisez notre plateforme dans une autre langue maintenant.
In 2019, the Mexican provider of lightweighting solutions for the global automotive industry Nemak invested 9.1 million U.S. dollars on several environmental protection and risk preventions programs, from which around 51.6 percent was spent on waste disposal and reduction programs.
Nemak's sustainability spending in 2019, by area of investment (in million U.S. dollars)
Basic Account
Get to know the platform
You only have access to basic statistics.
This statistic is not included in your account.
Starter Account
The ideal entry-level account for individual users
- Instant access to 1m statistics
- Download in XLS, PDF & PNG format
- Detailed references
$199 USD / Month *
Professional Account
Full access
Business Solutions including all features.
* Prices do not include sales tax.
Other statistics that may interest you Statistics on
About the industry
10
- Basic Statistic Nemak revenue 2018, by region
- Premium Statistic Revenue of Nemak 2014-2018
- Premium Statistic U.S. auto dealerships - sales breakdown by department 2018-2021
- Premium Statistic U.S. automotive dealerships' service sales by type 2021
- Premium Statistic Producer price index - U.S. motor vehicle engine parts manufacturing 2019
- Premium Statistic Producer price index - U.S. motor vehicle manufacturing 2004-2019
- Premium Statistic Producer price index - U.S. motor vehicle equipment manufacturing 2019
- Premium Statistic Federal-Mogul's net sales by segment 2016
- Premium Statistic Industry revenue of “manufacture of bodies for motor vehicles and trailers“ in Portugal 2012-2025
- Premium Statistic Industry revenue of “manufacture of bodies for motor vehicles and trailers“ in the Netherlands 2012-2025
About the region
9
- Premium Statistic AutoZone - number of employees 2010-2023
- Premium Statistic Advance Auto Parts - total assets 2018
- Premium Statistic Automotive composites - global market size 2025
- Premium Statistic Tenneco - net sales by market 2021
- Premium Statistic Tenneco - net sales by segment 2021
- Basic Statistic Automotive interior materials market size worldwide 2020-2030
- Premium Statistic Automotive aftermarket: Dorman's net sales 2009-2018
- Basic Statistic Size of the global automotive accessories market 2017-2022
- Basic Statistic ZF Friedrichshafen AG - EBIT 2009-2023
Selected statistics
1
Other regions
10
- Premium Statistic O’Reilly Automotive - operating income 2004-2021
- Premium Statistic O'Reilly Auto Parts- revenue 2004-2023
- Premium Statistic Manufacture of bodies for motor vehicles and trailers revenue in Sweden 2010-2022
- Premium Statistic Manufacture of bodies for motor vehicles and trailers revenue in the Netherlands 2010-2022
- Premium Statistic Manufacture of bodies for motor vehicles and trailers revenue in the United Kingdom 2010-2022
- Premium Statistic Manufacture of bodies for motor vehicles and trailers revenue in Czechia 2014-2022
- Basic Statistic Forecast: revenue motor vehicle body manufacture Spain 2009-2020
- Basic Statistic Forecast: revenue motor vehicle body manufacture France 2008-2020
- Basic Statistic Forecast: revenue motor vehicle body manufacture Germany 2008-2020
- Premium Statistic Import value of vehicles in Poland 2008-2022
Related statistics
10
- Premium Statistic Share of the after sales segment in car dealers' revenue in China up to 2014
- Premium Statistic Distribution of vehicle after-sales market in China by channel 2015-2020
- Premium Statistic Market value of vehicle after-sales in China 2015-2020
- Premium Statistic Number of employees at FAW Jiefang Group in China 2010-2023
- Premium Statistic Mexico: tires import value 2020, by country of origin
- Premium Statistic Mexico: tires export value 2020, by country of destination
- Premium Statistic Canadian automotive industry - exports by territory 2020
- Premium Statistic Small diesel engine vehicle: sales value in the United Kingdom (UK) 2010-2019
- Premium Statistic Tire mold output in China 2015-2025
- Premium Statistic Revenue of Himile Mechanical Science 2018, by segment
Further related statistics
10
- Eni S.p.A.'s oil spills from operations 2009-2019
- Puma Group's market capitalization worldwide 1993-2023
- China: SAIC auto sales by type 2009-2021
- China National Building Material drywall sales volume 2012-2022
- Total assets of China National Building Material 2012-2022
- Most used HVAC brands in the U.S. 2018
- Most used lighting brands in the U.S. 2018
- Alpine ski bindings and boots retail sales in the U.S. 2010-2016
- Most used refrigerators brands in the U.S. 2015
- Top 10 countries by biocapacity 2010
Further Content: You might find this interesting as well
Statistics
- Eni S.p.A.'s oil spills from operations 2009-2019
- Puma Group's market capitalization worldwide 1993-2023
- China: SAIC auto sales by type 2009-2021
- China National Building Material drywall sales volume 2012-2022
- Total assets of China National Building Material 2012-2022
- Most used HVAC brands in the U.S. 2018
- Most used lighting brands in the U.S. 2018
- Alpine ski bindings and boots retail sales in the U.S. 2010-2016
- Most used refrigerators brands in the U.S. 2015
- Top 10 countries by biocapacity 2010
Nemak. (February 25, 2020). Nemak's sustainability spending in 2019, by area of investment (in million U.S. dollars) [Graph]. In Statista. Retrieved May 21, 2024, from https://www.statista.com/statistics/715595/nemak-sustainability-spending-investment/
Nemak. "Nemak's sustainability spending in 2019, by area of investment (in million U.S. dollars)." Chart. February 25, 2020. Statista. Accessed May 21, 2024. https://www.statista.com/statistics/715595/nemak-sustainability-spending-investment/
Nemak. (2020). Nemak's sustainability spending in 2019, by area of investment (in million U.S. dollars). Statista. Statista Inc.. Accessed: May 21, 2024. https://www.statista.com/statistics/715595/nemak-sustainability-spending-investment/
Nemak. "Nemak's Sustainability Spending in 2019, by Area of Investment (in Million U.S. Dollars)." Statista, Statista Inc., 25 Feb 2020, https://www.statista.com/statistics/715595/nemak-sustainability-spending-investment/
Nemak, Nemak's sustainability spending in 2019, by area of investment (in million U.S. dollars) Statista, https://www.statista.com/statistics/715595/nemak-sustainability-spending-investment/ (last visited May 21, 2024)
Nemak's sustainability spending in 2019, by area of investment (in million U.S. dollars) [Graph], Nemak, February 25, 2020. [Online]. Available: https://www.statista.com/statistics/715595/nemak-sustainability-spending-investment/