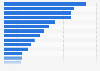
Veuillez noter que la page demandée n’est pas disponible dans la langue par défaut sélectionnée. Vous utilisez notre plateforme dans une autre langue maintenant.
This statistic shows the number of part-time vacancies in Finland from Q1 2015 to Q2 2018. During the first quarter of every year a higher number of vacancies are available. In the second quarter of 2018, 9,300 part-time positions were vacant.
Number of part-time vacancies in Finland from Q1 2015 to Q2 2018*
Loading statistic...
Basic Account
Get to know the platform
You only have access to basic statistics.
Starter Account
The ideal entry-level account for individual users
- Instant access to 1m statistics
- Download in XLS, PDF & PNG format
- Detailed references
$199 USD / Month *
Professional Account
Full access
Business Solutions including all features.
* Prices do not include sales tax.
Other statistics that may interest you Statistics on
About the industry
10
- Basic Statistic Number of employed persons in arts and entertainment activities in Finland 2008-2018
- Basic Statistic Employment rate in Finland 2013-2023
- Basic Statistic Labor cost index in the construction industry in Finland 2012-2022
- Basic Statistic Labor cost index in the transportation and storage industry in Finland 2012-2022
- Basic Statistic Labor cost index in the finance and insurance industry in Finland 2012-2022
- Basic Statistic Number of employed persons in the construction industry in Finland 2008-2018
- Basic Statistic Employed persons in wholesale, retail and repair of motor vehicles in Finland 2018
- Basic Statistic Number of persons employed in public administration and defence in Finland 2008-2018
- Basic Statistic Number of employees with lowest level tertiary education in Finland 2007-2017
- Basic Statistic Number of employees with a lower-degree level tertiary education in Finland 2007-2017
About the region
10
- Basic Statistic Number of employed persons in agriculture, forestry, and fishing in Finland 2008-2018
- Basic Statistic Number of employees in Finland 2016, by education level
- Basic Statistic Number of labor disputes in Finland 2012-2022
- Basic Statistic Number of work days lost due to labor disputes in Finland 2012-2022
- Basic Statistic Manufacturing of food products: number of employees in Finland 2012-2021
- Basic Statistic Employment rate in Finland 2013-2023, by age group
- Basic Statistic Unemployment benefit recipients in Finland 2012-2022
- Basic Statistic Expenditure on unemployment benefits in Finland 2012-2022
- Basic Statistic Number of unemployment benefit recipients in Finland 2022, by type
- Basic Statistic General government expenditure on social protection in Finland 2012-2022
Selected statistics
3
Other regions
10
- Premium Statistic Quarterly GDP growth rate in Taiwan Q1 2021-Q1 2024
- Basic Statistic Manufacturing of food products: number of employees in Lithuania 2012-2021
- Premium Statistic Canada: employment level 2022, by province
- Premium Statistic Egypt: consumers' confidence in own economic future 2015
- Basic Statistic Manufacturing of food products: number of employees in Turkey 2009-2014
- Basic Statistic Employment rate in Northern Ireland (UK) 2011-2019
- Premium Statistic Closure rates of female-owned businesses worldwide 2020, by region
- Premium Statistic Employees with fixed-term contracts in Italy 2020, by region
- Basic Statistic Manufacturing of food products: number of employees in Greece 2012-2021
- Basic Statistic Food product manufacturing industry: number of employees in the UK 2007-2018
Related statistics
10
- Basic Statistic General government expenditure on environmental protection in Finland 2012-2022
- Basic Statistic Government expenditure on recreation, culture and religion in Finland 2012-2022
- Basic Statistic Government expenditure on public order and safety relative to GDP Finland 2012-2022
- Basic Statistic Government expenditure on environmental protection relative to GDP Finland 2012-2022
- Basic Statistic General government expenditure on education in Finland 2012-2022
- Basic Statistic Labor cost index in the manufacturing industry in Finland 2012-2022
- Basic Statistic Labor cost index in the private sector in Finland 2012-2022
- Basic Statistic Number of employees that partook in labour disputes in Finland 2008-2018
- Basic Statistic Government expenditure on housing and community amenities in Finland 2007-2017
- Basic Statistic General government expenditure on defence relative to GDP in Finland 2007-2017
Further related statistics
10
- Number of CBRE Group employees 2009-2023
- Biofuels related jobs worldwide by region 2019
- Importance of management's recognition to job satisfaction of U.S. employees 2015
- U.S. employees - engagement behaviors in the workplace 2012
- U.S. employees - satisfaction with independence and autonomy at workplace 2012
- U.S. employees - satisfaction with career development opportunities 2012
- U.S. employees - importance of job security 2012
- John Lewis Partnership: number of employees in the United Kingdom (UK) 2009-2023
- Number of employees of the adidas Group worldwide from 2000 to 2023
- Air Liquide's number of employees 2005-2023
Further Content: You might find this interesting as well
Statistics
- Number of CBRE Group employees 2009-2023
- Biofuels related jobs worldwide by region 2019
- Importance of management's recognition to job satisfaction of U.S. employees 2015
- U.S. employees - engagement behaviors in the workplace 2012
- U.S. employees - satisfaction with independence and autonomy at workplace 2012
- U.S. employees - satisfaction with career development opportunities 2012
- U.S. employees - importance of job security 2012
- John Lewis Partnership: number of employees in the United Kingdom (UK) 2009-2023
- Number of employees of the adidas Group worldwide from 2000 to 2023
- Air Liquide's number of employees 2005-2023
Statistics Finland. (August 17, 2018). Number of part-time vacancies in Finland from Q1 2015 to Q2 2018* [Graph]. In Statista. Retrieved May 19, 2024, from https://www.statista.com/statistics/532750/number-of-part-time-vacancies-by-quarter-in-finland/
Statistics Finland. "Number of part-time vacancies in Finland from Q1 2015 to Q2 2018*." Chart. August 17, 2018. Statista. Accessed May 19, 2024. https://www.statista.com/statistics/532750/number-of-part-time-vacancies-by-quarter-in-finland/
Statistics Finland. (2018). Number of part-time vacancies in Finland from Q1 2015 to Q2 2018*. Statista. Statista Inc.. Accessed: May 19, 2024. https://www.statista.com/statistics/532750/number-of-part-time-vacancies-by-quarter-in-finland/
Statistics Finland. "Number of Part-time Vacancies in Finland from Q1 2015 to Q2 2018*." Statista, Statista Inc., 17 Aug 2018, https://www.statista.com/statistics/532750/number-of-part-time-vacancies-by-quarter-in-finland/
Statistics Finland, Number of part-time vacancies in Finland from Q1 2015 to Q2 2018* Statista, https://www.statista.com/statistics/532750/number-of-part-time-vacancies-by-quarter-in-finland/ (last visited May 19, 2024)
Number of part-time vacancies in Finland from Q1 2015 to Q2 2018* [Graph], Statistics Finland, August 17, 2018. [Online]. Available: https://www.statista.com/statistics/532750/number-of-part-time-vacancies-by-quarter-in-finland/