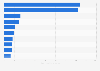
Veuillez noter que la page demandée n’est pas disponible dans la langue par défaut sélectionnée. Vous utilisez notre plateforme dans une autre langue maintenant.
According to a survey conducted in China in 2021, around half of surveyed travel managers said their companies chose to pay up to 300 yuan per night for a hotel for their employees on a business trip in third and fourth tier cities in China. Only one percent of surveyed companies spent more than a thousand yuan per hotel room per night.
Distribution of hotel price paid by companies for their business travelers in third and fourth tier cities in China in 2021
Basic Account
Get to know the platform
You only have access to basic statistics.
This statistic is not included in your account.
Starter Account
The ideal entry-level account for individual users
- Instant access to 1m statistics
- Download in XLS, PDF & PNG format
- Detailed references
$199 USD / Month *
Professional Account
Full access
Business Solutions including all features.
* Prices do not include sales tax.
Other statistics that may interest you Statistics on
About the industry
8
- Premium Statistic Most expensive cities for business travel APAC Q4 2022, by hotel cost
- Premium Statistic Leading upper midscale hotels for business travel in the U.S. in 2020
- Premium Statistic Leading midscale hotel brands for business travel in the U.S. in 2020
- Premium Statistic Leading luxury hotel brands for business travel in the U.S. in 2020
- Premium Statistic Leading upscale extended stay hotel brands for business travel in the U.S. in 2020
- Premium Statistic Leading midscale extended stay hotel brands for business travel in the U.S. in 2020
- Premium Statistic Leading upper upscale hotel brands for business travel in the U.S. in 2020
- Premium Statistic Leading upscale hotel brands for business travel in the U.S. in 2020
About the region
9
- Premium Statistic Annual revenue of Huazhu Hotels Group FY 2013-FY 2023
- Premium Statistic Gross profit of Huazhu Hotels Group FY 2013-FY 2023
- Premium Statistic Number of hotels of Huazhu Hotels Group in Greater China 2023, by location and type
- Premium Statistic Number of employees at Huazhu Hotels Group FY 2013-FY 2023
- Premium Statistic Distribution of migrant workers in China 2013-2023, by economic sector
- Premium Statistic BTG Hotels Group's annual revenue 2015-2023
- Premium Statistic Value added to GDP in China 2013-2023, by industry
- Premium Statistic Consumer spending distribution of urban and rural households in China 2023, by use
- Premium Statistic GDP of Henan province, China 1990-2022, by sector
Other regions
10
- Premium Statistic Average tourist expenditure per day and person in Auvergne-Rhône-Alpes, France 2018
- Basic Statistic Group owned hotels in the United Kingdom (UK) in 2013
- Premium Statistic Leading factors to decide on accommodation services Spain 2018
- Premium Statistic Overnight accommodation costs in New York 2023, by month
- Premium Statistic Leading hotel brands in Turkey in 2016, by number of hotels
- Basic Statistic Central America: number of 3- to 5-star hotels 2017
- Premium Statistic Central America: number of hotels by rating 2017
- Premium Statistic Most important hotel deliveries in Romania 2020-2022, by hotel capacity
- Premium Statistic Rezidor Hotel Group: number of hotels 2013-2019
- Premium Statistic Average RevPAR of Scandic hotels 2013-2019
Related statistics
10
- Premium Statistic Number of establishments in the accommodation industry in Hong Kong 2011-2021
- Premium Statistic Accommodation service provider number in Hong Kong 2021, by employee number
- Premium Statistic Major hotel chains based on number of hotels in China 2023
- Premium Statistic Major hotel chains based on number of hotel rooms in China 2023
- Premium Statistic Breakdown of foreign tourist arrivals in China 2019, by age group
- Basic Statistic Wi-Fi speed in selected hotels in Hong Kong as of July 2021
- Premium Statistic Revenue of Shanghai Jin Jiang Capital Ltd. China 2011-2021
- Premium Statistic Net profit of Shanghai Jin Jiang Capital Ltd. China 2018-2021
- Premium Statistic Total assets of Shanghai Jin Jiang Capital Ltd. China 2011-2021
- Premium Statistic Number of hotels of Shanghai Jin Jiang Capital Ltd. 2019-2020, by category
Further related statistics
10
- Operating income of Marriott International worldwide 2007-2023
- Revenue of Marriott International worldwide 1999-2023
- Global occupancy rate of Marriott International hotels 2010-2023, by region
- Number of Marriott International employees worldwide 2007-2023
- Number of available rooms in Las Vegas 2000-2022
- Hotel occupancy rate in Las Vegas 2001-2022
- Quarterly average daily rate of hotels in Houston 2016-2017
- Quarterly average daily rate of hotels in Indianapolis 2016-2017
- Quarterly average daily rate of hotels in New York 2016-2017
- Quarterly average daily rate of hotels in Philadelphia 2016-2017
Further Content: You might find this interesting as well
Statistics
- Operating income of Marriott International worldwide 2007-2023
- Revenue of Marriott International worldwide 1999-2023
- Global occupancy rate of Marriott International hotels 2010-2023, by region
- Number of Marriott International employees worldwide 2007-2023
- Number of available rooms in Las Vegas 2000-2022
- Hotel occupancy rate in Las Vegas 2001-2022
- Quarterly average daily rate of hotels in Houston 2016-2017
- Quarterly average daily rate of hotels in Indianapolis 2016-2017
- Quarterly average daily rate of hotels in New York 2016-2017
- Quarterly average daily rate of hotels in Philadelphia 2016-2017
Website (toutiao.com). (May 25, 2022). Distribution of hotel price paid by companies for their business travelers in third and fourth tier cities in China in 2021 [Graph]. In Statista. Retrieved June 01, 2024, from https://www.statista.com/statistics/1316000/china-breakdown-of-business-trip-hotel-price-in-third-and-fourth-tier-cities/
Website (toutiao.com). "Distribution of hotel price paid by companies for their business travelers in third and fourth tier cities in China in 2021." Chart. May 25, 2022. Statista. Accessed June 01, 2024. https://www.statista.com/statistics/1316000/china-breakdown-of-business-trip-hotel-price-in-third-and-fourth-tier-cities/
Website (toutiao.com). (2022). Distribution of hotel price paid by companies for their business travelers in third and fourth tier cities in China in 2021. Statista. Statista Inc.. Accessed: June 01, 2024. https://www.statista.com/statistics/1316000/china-breakdown-of-business-trip-hotel-price-in-third-and-fourth-tier-cities/
Website (toutiao.com). "Distribution of Hotel Price Paid by Companies for Their Business Travelers in Third and Fourth Tier Cities in China in 2021." Statista, Statista Inc., 25 May 2022, https://www.statista.com/statistics/1316000/china-breakdown-of-business-trip-hotel-price-in-third-and-fourth-tier-cities/
Website (toutiao.com), Distribution of hotel price paid by companies for their business travelers in third and fourth tier cities in China in 2021 Statista, https://www.statista.com/statistics/1316000/china-breakdown-of-business-trip-hotel-price-in-third-and-fourth-tier-cities/ (last visited June 01, 2024)
Distribution of hotel price paid by companies for their business travelers in third and fourth tier cities in China in 2021 [Graph], Website (toutiao.com), May 25, 2022. [Online]. Available: https://www.statista.com/statistics/1316000/china-breakdown-of-business-trip-hotel-price-in-third-and-fourth-tier-cities/