Veuillez noter que la page demandée n’est pas disponible dans la langue par défaut sélectionnée. Vous utilisez notre plateforme dans une autre langue maintenant.

Ways of watching TV content in the U.S. 2019, by ethnicity
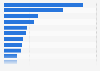
Share of adults who watch TV content using selected media in the United States as of April 2019, by ethnicity

Download
Show detailed source information?
Register for free
Already a member?
Log in
Source

Use Ask Statista Research Service

In cooperation with
Release date

August 2019

Region

United States

Survey time period

April 2019

Number of respondents

1,250*

Age group

18-64 years

Method of interview

Omnibus survey

Supplementary notes

*The total sample size was 1,250, of which 500 respondents were Hispanics, 250 were Whites, 250 were African Americans, and 250 were Asians.

Citation formats
Statista Accounts: Access All Statistics. Starting from $2,388 USD / Year
Basic Account
Get to know the platform

You only have access to basic statistics.
This statistic is not included in your account.

Starter Account
The ideal entry-level account for individual users
  • Instant access to 1m statistics
  • Download in XLS, PDF & PNG format
  • Detailed references
$199 USD / Month *
Professional Account
Full access

Business Solutions including all features.

* Prices do not include sales tax.

Other statistics that may interest you

Other statistics that may interest you Statistics on

About the industry

8

About the region

10

Selected statistics

1

Other regions

8

Related statistics

9

Further related statistics

10
Statista Accounts: Access All Statistics. Starting from $2,388 USD / Year
Learn more about how Statista can support your business.